
Are you wondering what kind of information about the Egyptian organizations the Darkweb has? As we all remember, the last few years were bad for many organizations regarding hacking and cyber threats.
Digital shadows team published research indicating that there is ~24 Billion credentials pair available already on darkweb.
These credentials sources vary from public database breaches or credentials in malware logs files extracted from compromised machines. The latter makes a greater risk, as from our redteaming experience, in 40% of cases, we could get direct access to sensitive data by using compromised credentials from malware logs.
Nowadays, keeping an eye on public database breaches and deep/dark web markets and forums for potential exposure of your digital assets is essential for any organization or security team to minimize the potential damage.
In this research, We’re providing statistics regarding Egyptian organizations’ compromised human or digital assets from various underground sources from threat actors’ perspectives.
Contents
TL;DR
We’ve investigated 2570 Egyptian organizations to find out how many organizations have compromised users whose data is being leaked through public breaches or sold via darkweb markets.
We found out that 62% (1606) of the Egyptian organizations have at least one breached employee account, 47% (1216) have at least one host mentioned in the threat actors’ sources, and 74% (1914) got at least one compromised user or hostname. 23% (611) of start-ups showed high indicators of potential compromise as they were exposed in all sources (Public database breaches, Malware stealer logs, and dark web markets) more than once.
Disclaimer
There was no active interaction with any organization’s assets for any purpose. All the data mentioned in this report were passively collected by DeXpose team from various resources.
We queried all the data mentioned in this report from Dexpose’s dataset, which was passively collected by DeXpose team from various resources.
Introduction
Over the last few years, threat actors highly utilized public database breaches and credentials exfiltrated from pre-compromised machines sold on deep or dark web markets to gain initial access to organizations worldwide.
At DeXpose, We’ve decided to investigate the exposure of Egyptian organizations in these markets and breaches to get an idea of how threat actors see these organizations’ digital assets in cyberspace.
Terms.
In this section, I will explain some heavily used terms in that research.
Malware logs
Threat actors spread their malware on a mass scale, either by binding it with some software crack or sending it embedded into a word file via a phishing email or other methods. One famous malware usage is exfiltrating the credentials (Usernames and passwords) for the applications installed on the compromised machine.
These applications include web browsers, messengers, File transfer apps, crypto wallets . . etc.
The output file containing these plaintext credentials is referred to as a Malware log file, and these logs are distributed or sold in bulk via various channels.
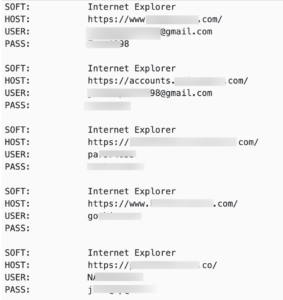
At DeXpose, we keep an eye on these bot logs, indexing them daily to notify our clients whenever any of their assets pop up, along with other details regarding the compromised user or host, so they can proactively handle that situation before it returns to an incident.
Deep/Dark web markets
The deep and dark web sites represent websites that are not indexed by search engines or need a particular type of connection (TOR) to access. Among these websites are private forums or digital marketplaces where threat actors exchange, sell or ask for buying bot logs or initial access to a specific organization.
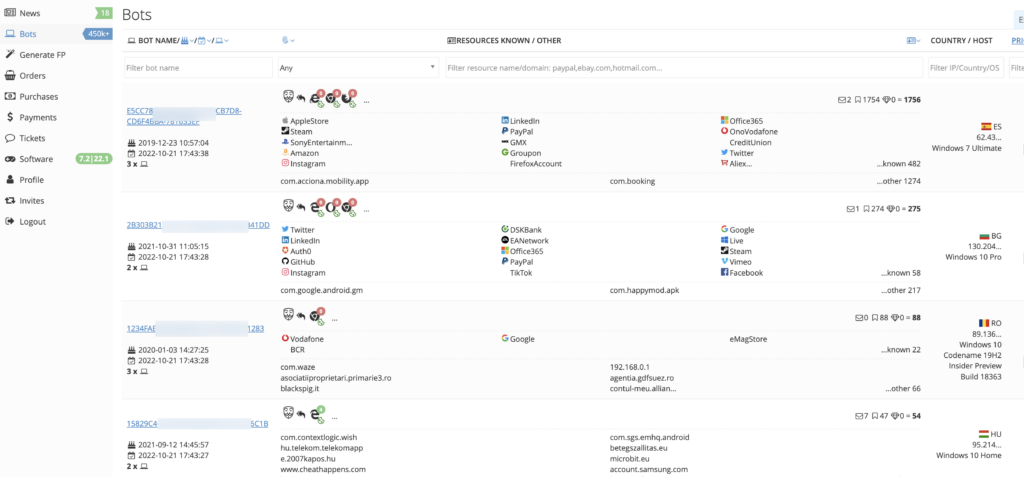
At DeXpose, we keep an eye on these marketplaces to notify our clients whenever any of their assets pop up, along with other details regarding the compromised user or host, so they can proactively handle that situation before it returns to an incident.
Public database breaches
Attackers usually leak or sell sensitive data when they compromise some organization. This data usually includes usernames, emails, passwords, and other sensitive information that other threat actors may reuse to compromise that service’s users whose accounts got leaked.
At DeXpose, We’re monitoring and indexing the latest leaked databases to help our clients keep an eye on their assets before these leaked credentials get reused to compromise the organization’s assets.
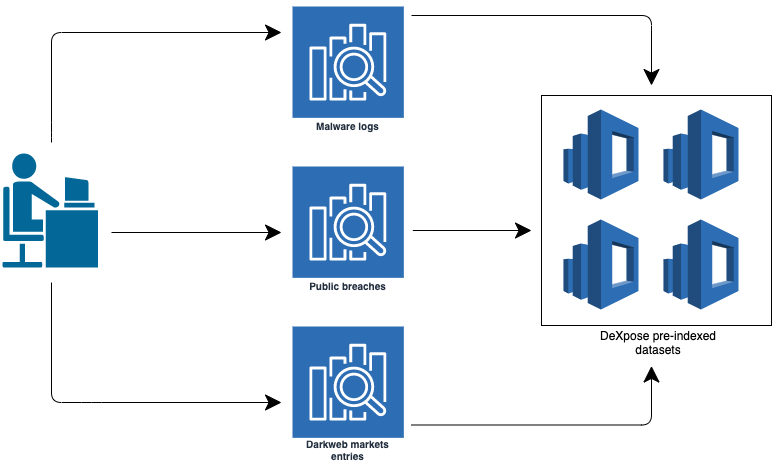
Sources
For the sake of that research, we depended entirely on our pre-indexed data set and limited the analysis to be against the following three sources
Malware logs / Bot logs
Public databases breaches
Deep/Dark web marketplaces
Risk of exposure
Leaking compromised credentials of the organization’s digital assets through these sources has many forms and can be abused in various methods.
Organizations’ email addresses exposed in public database breaches can be abused by threat actors via credential reuse to gain access to the organization’s assets.
Malware logs may contain access to sensitive web services and the employee credentials needed to access these services.
That specific scenario is how Uber was hacked the last month, and the UN was hacked the last year.
Some organizations may not have their employees’ sensitive data exposed, but there are breached credentials for their clients due to exfiltrating credentials from compromised clients’ machines.
This could cause damage if the organization provides premium services or stores users’ payment data or other sensitive info.
Keeping an eye on such compromised credentials was never a bad idea.
Methodology
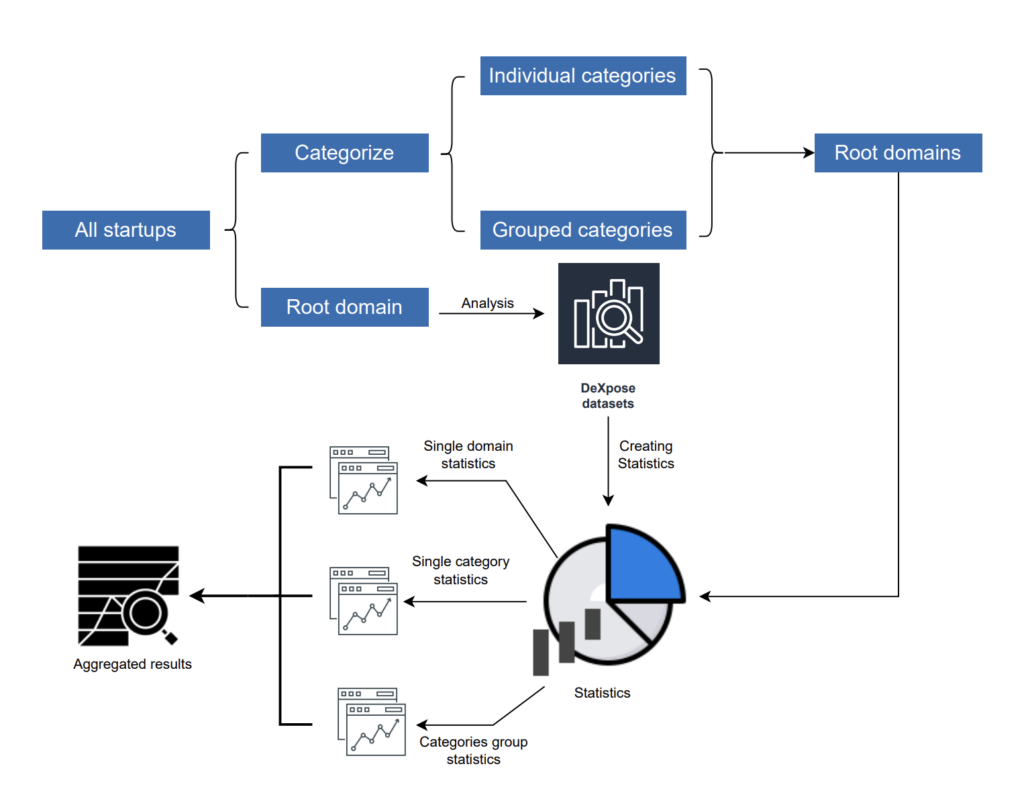
Preparing the inputs
1 – We’ve started obtaining a list of Egyptian organizations from various sources, creating a list of 2.6k organizations.
2 – We extracted each organization’s category and obtained its main root domain (example.com).
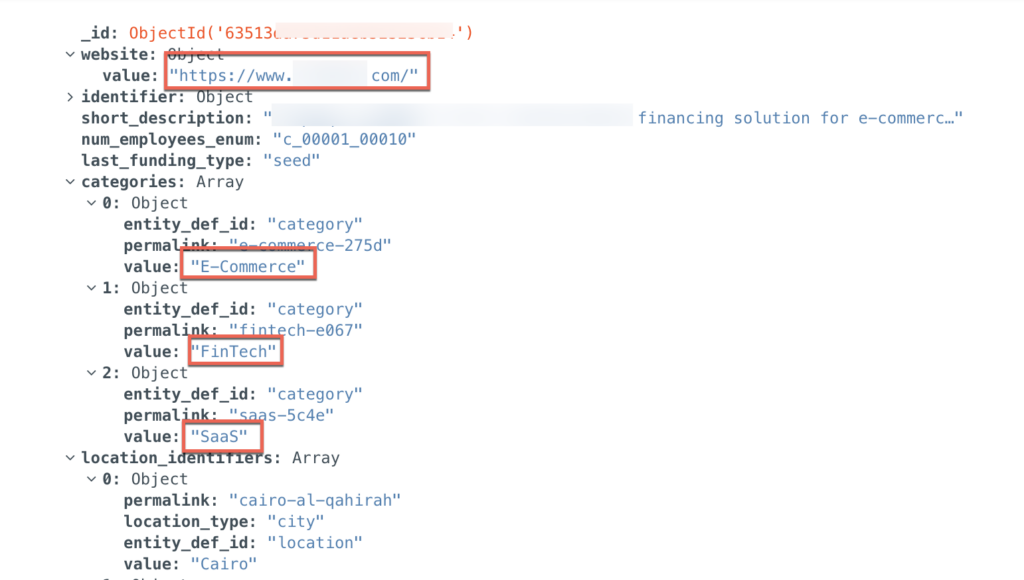
The result was obtaining 2574 root domains, sharing 544 categories.
Categorization
Besides the single categories, we wanted to focus more on CISA critical infrastructure sectors. We grouped some of the single categories to match the following critical sectors:
- Financial Services Sector: FinTech, Financial Services, Finance, Financial Exchanges, and Banking.
- Energy Sector: Renewable Energy, Wind Energy, Clean Energy, Energy, Energy Management, and Energy Storage
- Communications Sector: Information and Communications Technology (ICT), Satellite Communication, Telecommunications, Wired Telecommunications, Wireless, and Communications Infrastructure
- Information Technology Sector: Information Technology, Information and Communications Technology (ICT), IT Infrastructure, and IT Management
- Commercial Facilities Sector: Commercial, Commercial Insurance, Commercial Lending, and Commercial Real Estate
- Food and Agriculture Sector: Agriculture and AgTech
- Chemical Sector: Chemical and Chemical Engineering
- Critical Manufacturing Sector: Manufacturing, Machinery Manufacturing, Industrial Manufacturing, industrial, and Industrial Automation
We obtained the root domains for each category or sector to query their statistics later.
Getting statistics
For each domain name, we query the three mentioned sources. The target was to obtain the following data from our dataset.
Compromised email addresses belong to the target domain through publicly breached databases [*@example.com].
Compromised email addresses belong to the target domain found in malware logs [*@example.com].
Host names belong to the target domain with usernames and passwords breached [https://*.example.com] being sold in darkweb marketplaces.
Host names belong to the target domain with usernames and passwords breached [https://*.example.com] found in malware logs.
The main statistics point for each category or categories group are
- Category
- Total organizations count
- Organizations found in publicly breached databases.
- Organizations found in dark web markets.
- Organizations with compromised users from malware logs.
- Organizations with compromised hosts from malware logs.
- Organizations who got usernames or hosts mentioned at least one time in malware logs.
- Organizations with at least one breached user [From Malware logs + Breached DBs].
- Organizations with at least one compromised host [From Malware logs + Darkweb marketplaces]
- Organizations that have at least one compromised digital asset [Email address or hostname with credentials]
- Organizations mentioned in all three sources [malware logs, Dakweb marketplaces, and Breached DBs].
- Organizations have been mentioned in two sources.
- Organizations have been mentioned in one source.
Results
After making the analysis and correlations, we divided the results into three sections.
- Section representing the status of all Egyptian organizations.
- Section representing the status of organizations in each critical sector.
- Section representing the status of organizations in each category.
If you’re interested in the results sheet, drop us a message at info[at]dexpose.io
Overall status
Compromise source analysis.
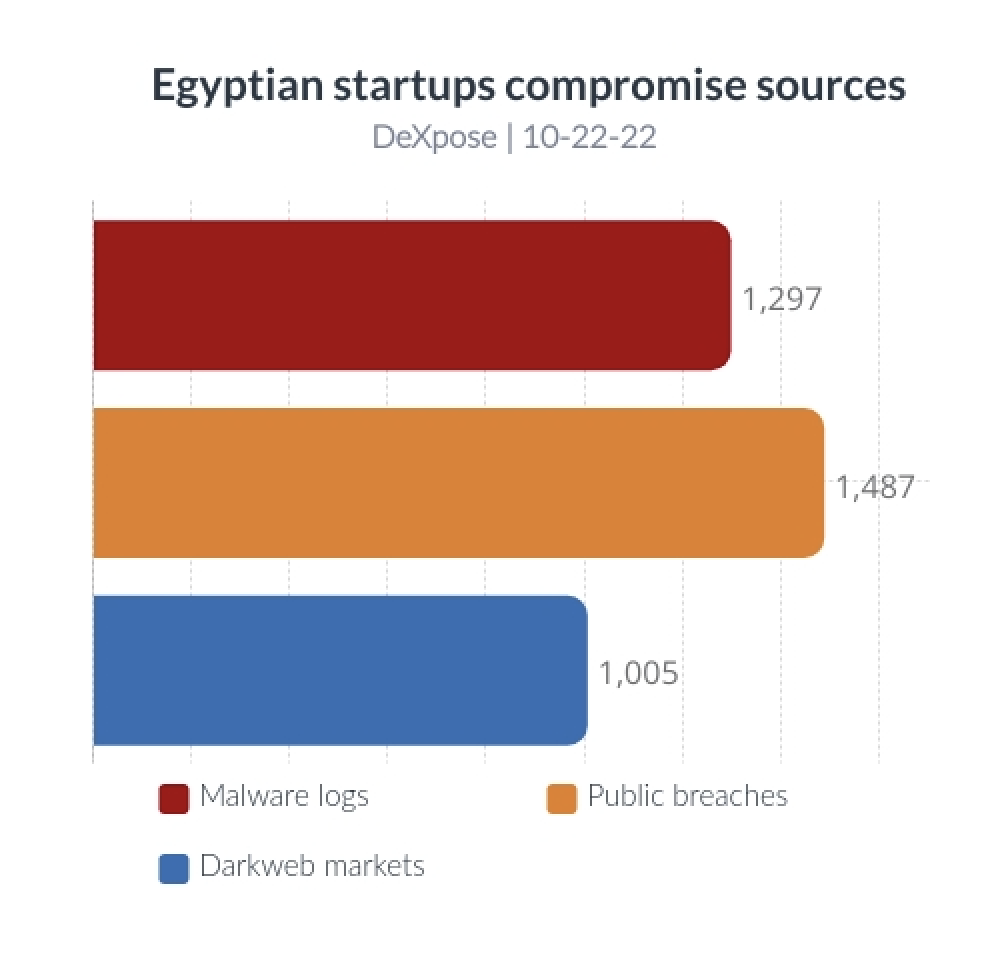
1,297 organizations have at least one user whose data was compromised by malware.
1,487 organizations have at least one user whose data was compromised through a publicly breached database.
1,005 organizations have at least one host mentioned in darkweb marketplaces.
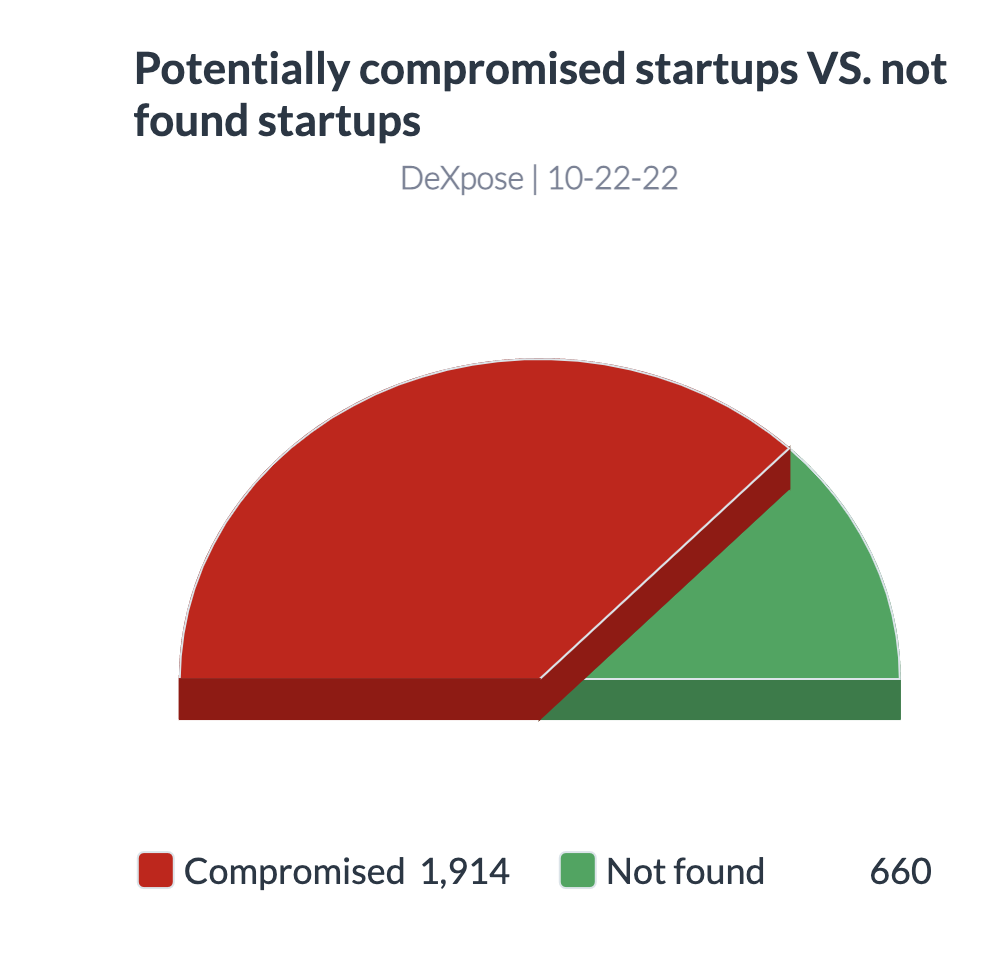
1,914 organizations have at least one employee username or host with compromised user data exposed through the mentioned sources.
While 660 other organizations were not found in our datasets (Using the root domain registered)
Potential compromise analysis
To get a more accurate picture of the risk of the exposed assets, we analyzed how many sources each organization mentioned.
If the organization mentioned in the three sources (Publicly breached databases, Malware stealer, and dark web marketplaces), this would lead to a critical sign of potential compromise that already took place or will take place shortly due to the nature of the exposed information.
While if the organization was mentioned in one or two sources, this would indicate a lower risk depending on the breach source.
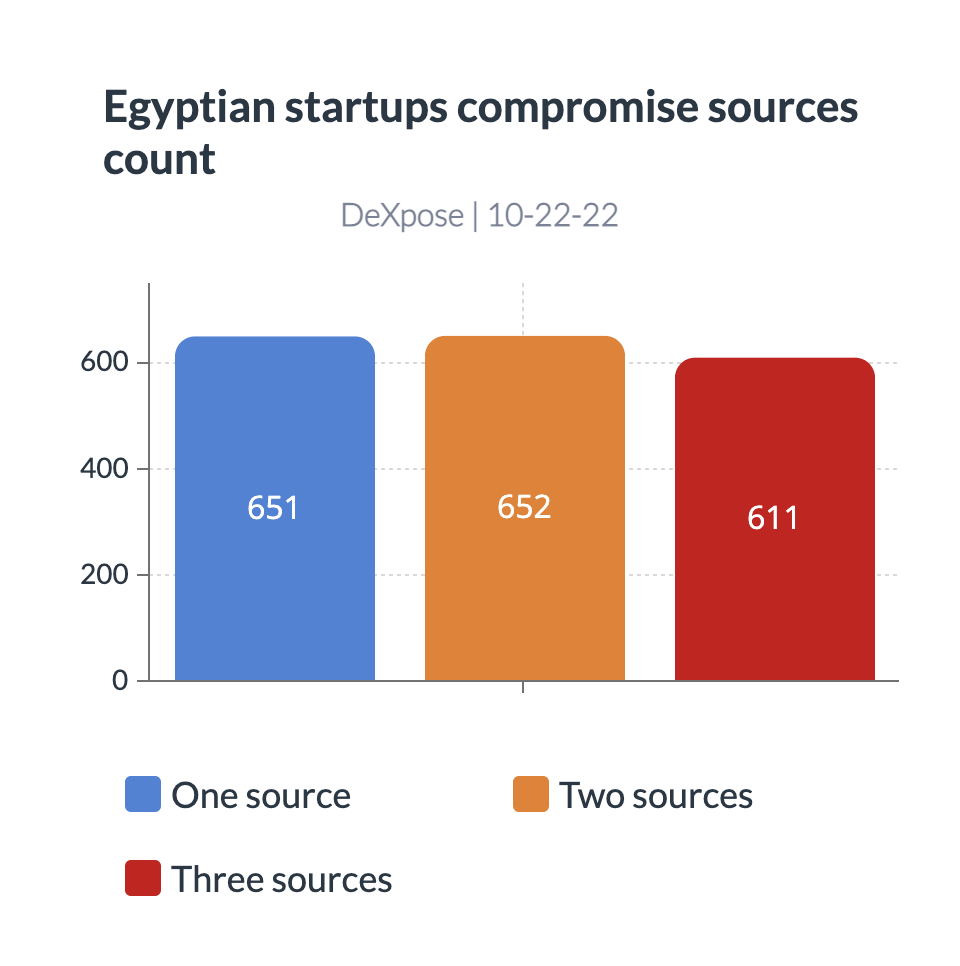
DeXpose team found 611 organization in the three sources, which should raise a considerable alarm.
The nature of the sources means that some of the employees’ data were exposed through publicly breached databases and that One or more machines where employees’ credentials are stored were compromised with malware.
652 organizations were found in the two sources, which should also raise the alarm.
651 organizations were found in a single source. The risk here depends on the source of compromise.
Summary
26% of Egyptian organizations (611) have a high probability of getting compromised (if not already) by abusing the data that threat actors can retrieve.
~74% of the Egyptian organizations (1914) have at least one compromised employee or credentials for hostname belonging to these organizations.
Unless these breached data are known to the organizations and handled already, they make a huge risk and attractive initial attack vector to threat actors.
Critical sectors
This section will discuss the mentioned critical sectors.
We will provide an overview regarding these sectors’ exposure, followed by a download section where you can download a single summarized report for each sector.
Overview
Compromise source analysis
The following chart illustrates the count of each sector’s organizations for each compromise source.
| Sector | Organizations count | organizations in public breached databases | organizations in malware logs | organizations mentioned in darkweb markets |
| Information Technology Sector | 370 | 224 | 137 | 147 |
| Financial Services Sector | 251 | 118 | 87 | 84 |
| Critical Manufacturing Sector | 224 | 164 | 72 | 83 |
| Commercial Facilities Sector | 78 | 40 | 29 | 28 |
| Communications Sector | 58 | 49 | 29 | 28 |
| Energy Sector | 51 | 36 | 16 | 12 |
| Chemical Sector | 21 | 17 | 9 | 6 |
| Food and Agriculture Sector | 20 | 10 | 5 | 4 |
organizations with at least one breached asset.
The following chart illustrates the count of organizations with at least one asset mentioned in compromise sources vs. those that weren’t found in the compromise sources using their root domain.
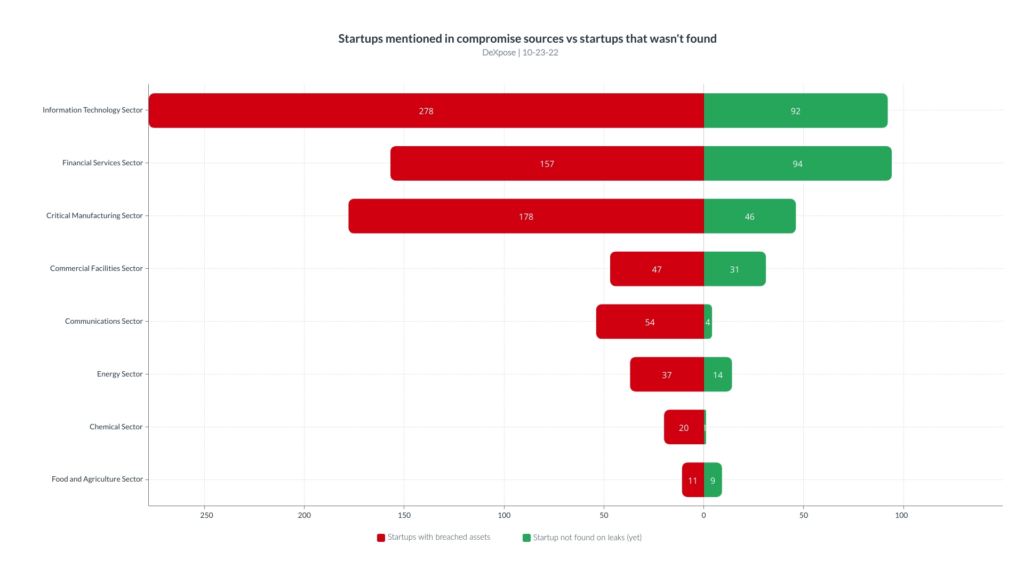
| Sector | Organizations count | organizations with a minimum one breached asset | organizations that weren’t found | Compromise percentage |
| Information Technology Sector | 370 | 278 | 92 | 33% |
| Financial Services Sector | 251 | 157 | 94 | 60% |
| Critical Manufacturing Sector | 224 | 178 | 46 | 26% |
| Commercial Facilities Sector | 78 | 47 | 31 | 66% |
| Communications Sector | 58 | 54 | 4 | 7% |
| Energy Sector | 51 | 37 | 14 | 38% |
| Chemical Sector | 21 | 20 | 1 | 5% |
| Food and Agriculture Sector | 20 | 11 | 9 | 82% |
Potential compromise analysis
As mentioned earlier, If the organizations is mentioned in the three sources (Publicly breached databases, Malware stealer, and dark web marketplaces), this would lead to a critical sign of potential compromise that already took place or will take place shortly due to the nature of the exposed information.
While if the organizations was mentioned in one or two sources, this would indicate a lower risk depending on the breach source.
The following chart illustrates the count of compromise sources for the critical sectors.
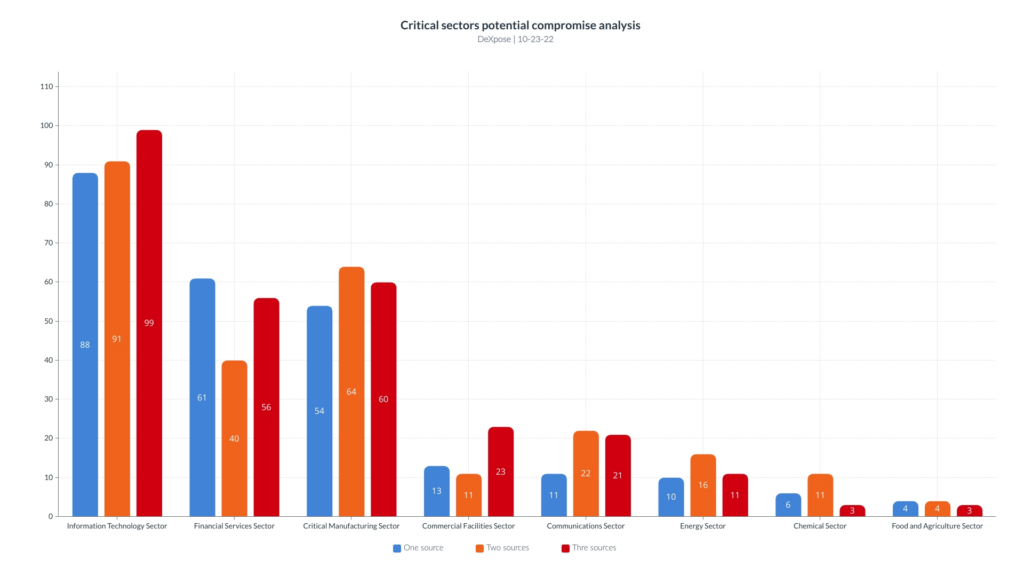
| Sector | Organizations count | organizations mentioned in a single source | organizations mentioned in two sources | organizations mentioned in three sources |
| Information Technology Sector | 370 | 88 | 91 | 99 |
| Financial Services Sector | 251 | 61 | 40 | 56 |
| Critical Manufacturing Sector | 224 | 54 | 64 | 60 |
| Commercial Facilities Sector | 78 | 13 | 11 | 23 |
| Communications Sector | 58 | 11 | 22 | 21 |
| Energy Sector | 51 | 10 | 16 | 11 |
| Chemical Sector | 21 | 6 | 11 | 3 |
| Food and Agriculture Sector | 20 | 4 | 4 | 3 |
Summary
The following table illustrates the number of organizations with a high probability of getting compromised through external data leakage per sector.
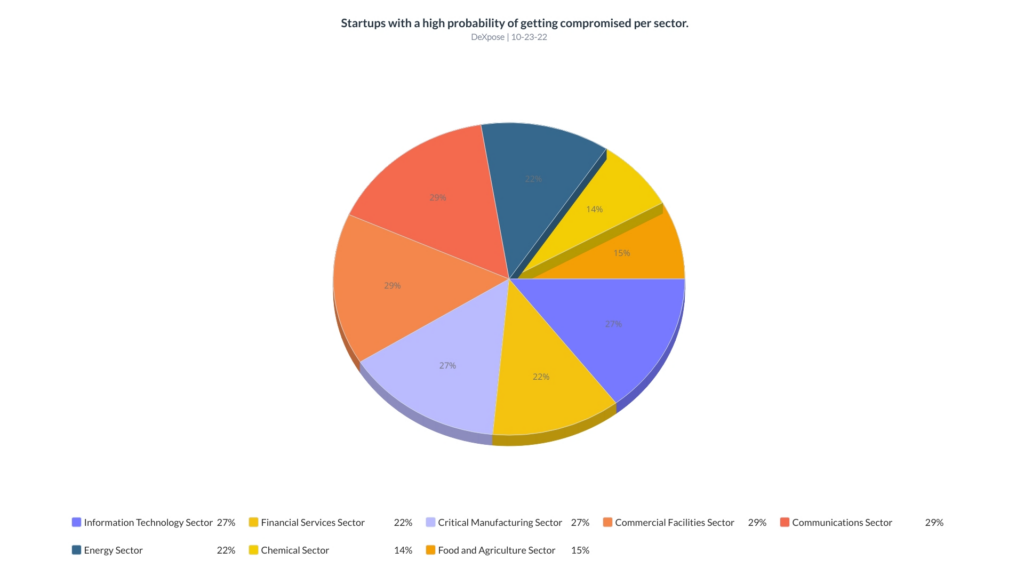
| Sector | organizations percentage |
| Information Technology Sector | 27% |
| Financial Services Sector | 22% |
| Critical Manufacturing Sector | 27% |
| Commercial Facilities Sector | 29% |
| Communications Sector | 29% |
| Energy Sector | 22% |
| Chemical Sector | 14% |
| Food and Agriculture Sector | 15% |
27% of the Information Technology Sector organizations (99) are highly likely to get compromised (if not already) by abusing the data that threat actors can retrieve.
22% of the Financial Services Sector organizations (56) are highly likely to get compromised (if not already) by abusing the data that threat actors can retrieve.
27% of the Critical Manufacturing Sector organizations (60) are highly likely to get compromised (if not already) by abusing the data that threat actors can retrieve.
29% of the Commercial Facilities Sector organizations (23) are highly likely to get compromised (if not already) by abusing the data that threat actors can retrieve.
29% of the Communications Sector organizations (21) are highly likely to get compromised (if not already) by abusing the data that threat actors can retrieve.
22% of the Energy Sector organizations (11) are highly likely to get compromised (if not already) by abusing the data that threat actors can retrieve.
14% of the Chemical Sector organizations (3) are highly likely to get compromised (if not already) by abusing the data that threat actors can retrieve.
15% of the Food and Agriculture Sector (3) are highly likely to get compromised (if not already) by abusing the data that threat actors can retrieve.
Download summarized reports
You can download the summarized report for each critical sector by going to the download section.
Single categories status
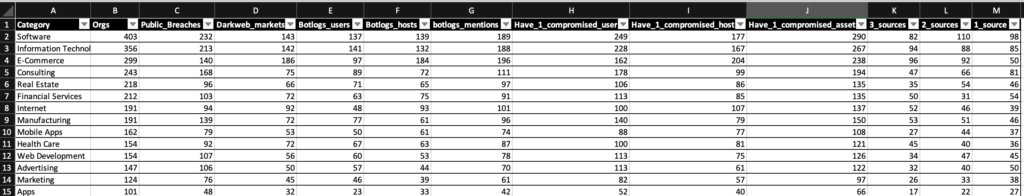
As we got 544 categories in the list, a single blog post isn’t the best place to present their whole statistics.
Instead, We will publish summarized statistics for the top 20 categories in terms of organization count and make the detailed sheet available for researchers to download.
Keep in mind that a single organization may be within multiple categories.
Number of organizations per category
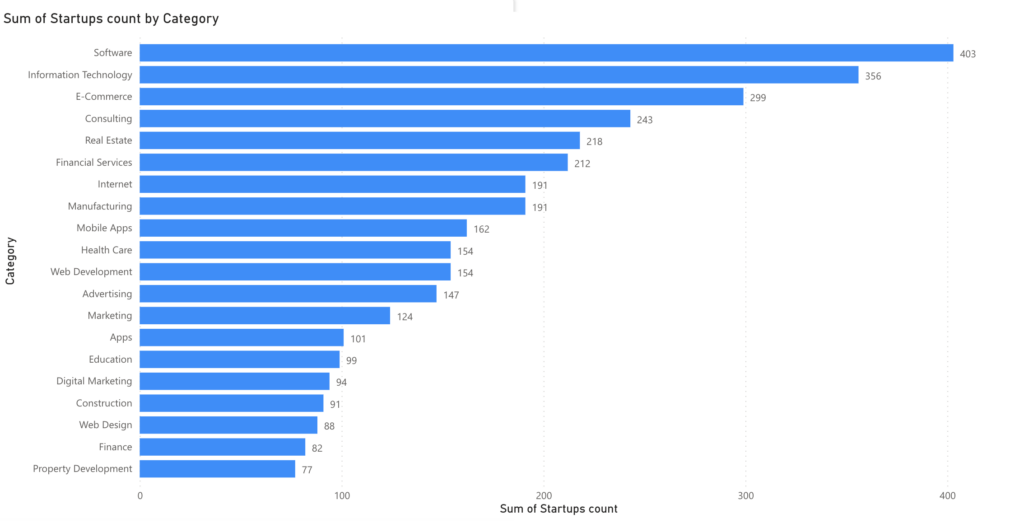
Unlike the critical sectors classes, where we made sure that the domain names were unique.
A single organization may occur within one or more categories (because it fits in there). That explains why you may find that the total number of organizations in the top 20 categories exceeds the total (unique) number of organizations we used for that research.
Compromise source analysis
Comparing the top 20 categories regarding exposure source.
Publicly breached databases
The organization count per category can be seen in blue, while the count of organizations that got human assets breached in public database breaches is red.
Darkweb markets
The organization count per category can be seen in blue, while the count of organizations with domain names mentioned in darkweb markets is red.
The E-Commerce category dominates this source, but it probably got many registered users whose machines might have been compromised. Not all hits came from employees’ machines.
Malware logs
Like darkweb markets hits, E-Commerce was mentioned a lot but mainly because of the public websites with open registration.
Organizations with at least one compromised asset
The organization count per category can be seen in blue, while the count of organizations with at least one mentioned email address or hostname is in red.
Conclusion
In this blog post, we’ve summarized statistics regarding the Egyptian organizations’ exposure from a threat actors perspective.
We’ve found that 26% of organizations have a high probability of getting compromised (if not already) due to compromised machines or publicly breached databases. This is a huge number and reflects a need to handle these issues as soon as possible.
These exposed data are being abused daily to gain a foothold over organizations worldwide.
24/7 monitoring against such exposure to get complete visibility over your exposed assets before threat actors abuse them isn’t a luxury anymore.
For the sake of privacy, we did not mention organizations’ names in that research. In case you are interested in getting a summarized exposure report for your organization, you can do so by clicking here
Download reports
Download the critical sectors summarized report.
Information Technology Sector startups exposure – Egypt – 22Q4 report download
Financial Services Sector startups exposure – Egypt – 22Q4 report download
Critical Manufacturing Sector startups exposure – Egypt – 22Q4 report download
Commercial Facilities Sector startups exposure – Egypt – 22Q4 report download
Communications Sector startups exposure – Egypt – 22Q4 report download
Energy Sector startups exposure – Egypt – 22Q4 report download
Chemical Sector startups exposure – Egypt – 22Q4 report download
Food and Agriculture Sector startups exposure – Egypt – 22Q4 report download
Download a single organization’s summarized report
For the sake of confidentiality, we can’t make each organization’s exposure analysis available for public download.
In case you represent an organization and would like to get a free exposure summary report, you can do so by requesting the report by clicking here.
Note: Your email address should belong to the organization you’re requesting a report for.
In case you got any inquiries or notes regarding any part of that research, please contact us by clicking here or drop us a message at info[at]dexpose.io